Employment Market Intelligence
More Jobs. No Relief.
The first improvement in more than a year deserves attention. So does the competition arriving with it. Australia's employment market is turning unevenly, and the candidate's task is becoming more specific.
Take the illustrated edition with you PDF ↓FROM THE EDITOR
A market can improve before a job search becomes easier. August is a study in that distinction. SEEK reported a 0.5% rise in job advertisements, the first monthly increase in over a year. Yet the report also placed applications per advertisement at a new high. More opportunity and more competition were present together.
This is the second issue in a continuing reading of Australia's employment market. Read it alongside July's Fewer Jobs. More Competition. Figures attributed to SEEK describe advertised demand and application activity. The candidate implications are FitGrid's interpretation.
01 / The national picture
A turn is a change in direction, not a return to normal.
July's public edition, Fewer Jobs. More Competition., described the conditions in SEEK's July release. August changes the first half of that description. A positive monthly result means advertised demand increased relative to the preceding month. It does not mean the market regained the opportunities lost over the preceding year.
SEEK's August release reported job advertisements up 0.5% month on month and down 4.5% year on year. That combination matters: the direction improved while the level remained below the previous year. A candidate can therefore encounter fresh openings and still face a narrower opportunity set than a year earlier.
The improvement should change our language. A continuous-collapse story is no longer defensible. Neither is a broad recovery declaration. The useful question is where the turn is occurring, whether it persists, and whether it reaches the kinds of roles a particular person can credibly pursue.
Our interpretation is that August warrants renewed investigation. It does not justify indiscriminate application. The candidate who uses an improving headline to abandon role discipline may simply enter more competitions without improving their position inside any of them.
02 / The competition ledger
The queue can grow while the door opens wider.
Applications per advertisement are a ratio of platform activity, not a count of unique competing people. One person can submit multiple applications. The measure cannot tell us how qualified the applicants are, how many are shortlisted, or why a particular employer rejects a candidate.
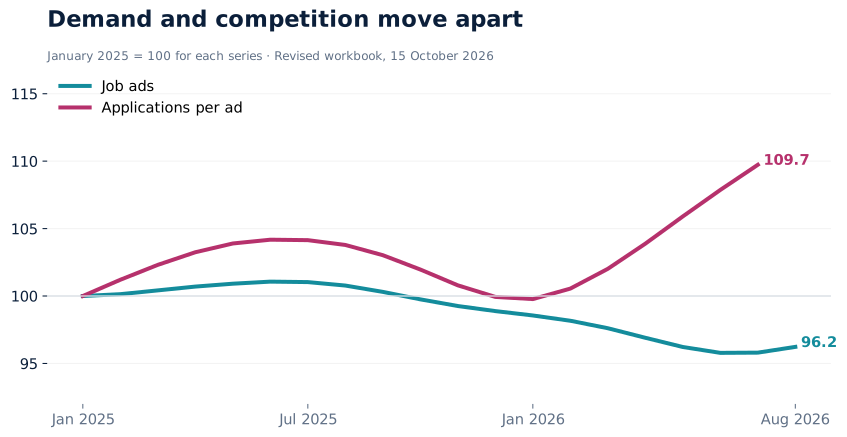
It still supplies useful context. The August release reported a further 0.4% increase in applications per ad, using July applications data because the measure arrives with a one-month lag. At the time of publication, SEEK described a new peak. The underlying competition story had not disappeared when advertisements began to rise.
There is a consequential revision. In the 15 October workbook, July applications per ad stand at 231.26, up 1.73% month on month, rather than the 0.4% first published. August subsequently reaches 235.17, up 1.69%. Those are later estimates and later information. We show them explicitly rather than silently rewriting what the August release said.
For a candidate, this is a reason to inspect the application funnel. Few interviews could reflect market pressure, weak targeting, insufficiently visible proof, timing or a combination. Aggregate competition establishes the conditions around the case. It cannot decide which explanation controls the case.
An improving market does not remove the need to make a specific, defensible case.
03 / The geographic fault lines
An Australian average is a poor address for a job search.
The August release described increases across the states, led by Victoria at 1.1%. Western Australia was the only state with annual growth in that release, at 1.8%. Those were the estimates available when SEEK published the report.
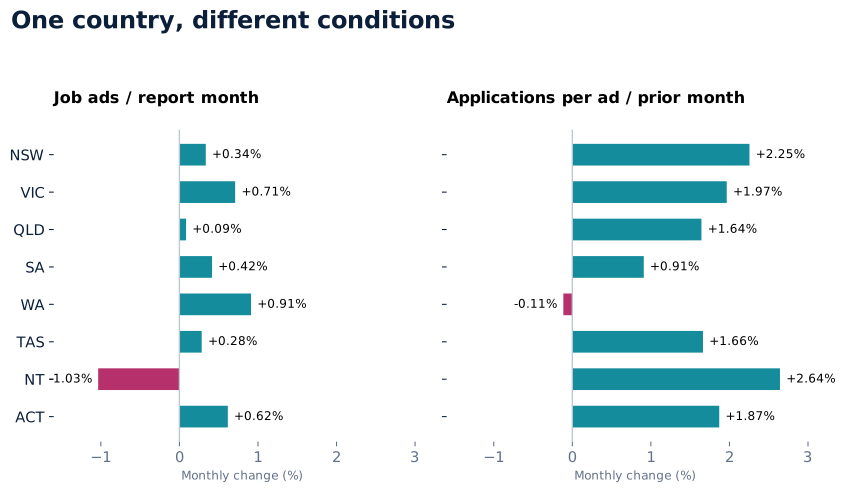
Revised figures sharpen the caution. The October workbook places August annual ad growth at +3.29% in WA and +0.42% in SA, while NSW remains −8.08% and the ACT −10.31%. The NT's revised monthly direction is negative. A later estimate can change both the size and the sign of a movement.
There is a second geographic distinction: demand and application pressure do not move in lockstep. July applications per ad in the latest workbook rose 2.25% in NSW and 1.97% in Victoria, while WA was broadly flat at −0.11%. These are changes within each state's own series. Index levels should not be used to declare that one state has a particular multiple of another state's applicants.
FitGrid inference: geography belongs inside the campaign design, alongside relocation feasibility, travel, work arrangements and genuine employer access. A stronger state headline is an invitation to inspect suitable roles. It is not evidence that a remote applicant will enjoy the same conditions as a local candidate.
04 / Where the movement lives
Hospitality accelerates. Annual strength remains concentrated.
Hospitality and Tourism rose 3.6% in August and 6.2% over the quarter. Banking and Financial Services increased 1.5% in the month; Human Resources and Recruitment rose 0.4%; Marketing and Communications rose 0.2%. These movements complicate a simple story that all office or professional work is weakening together.
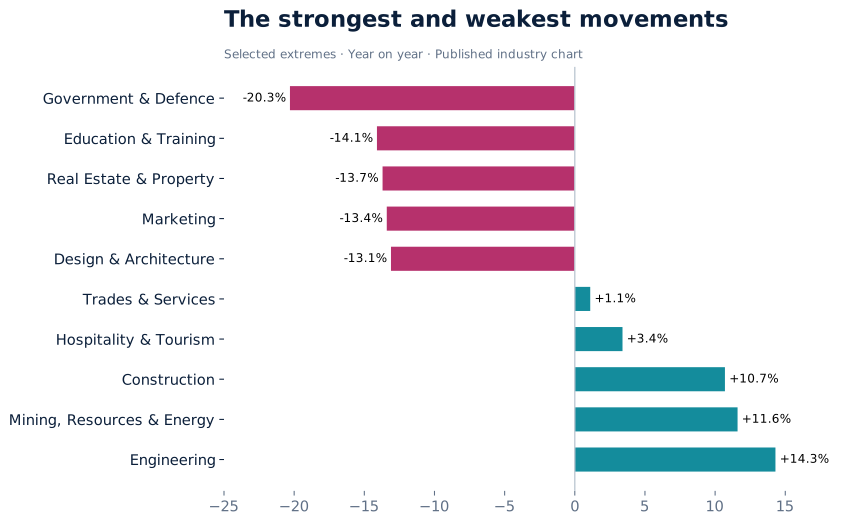
The annual picture remains more selective. Engineering was up 14.3%, Mining, Resources and Energy 11.6%, and Construction 10.7%. Meanwhile Government and Defence was down 20.3%, Education and Training 14.1%, and Marketing and Communications 13.4%. Only six of the 28 industry categories were above a year earlier.
A monthly improvement and an annual shortfall can coexist inside the same industry. Marketing's +0.2% month and −13.4% year illustrate that precisely. A candidate should neither dismiss a promising vacancy because the annual industry figure is weak nor assume that a small monthly rise makes the whole category easy.
The classification also describes the advertised role category, not a complete account of the employer's sector or the candidate's transferable capability. A finance leader employed by a resources business is not automatically participating in the same demand series as a mining engineer. Translate the evidence to the actual role before drawing a strategic conclusion.
05 / The AI signal
Fast growth. A small share. A more precise question.
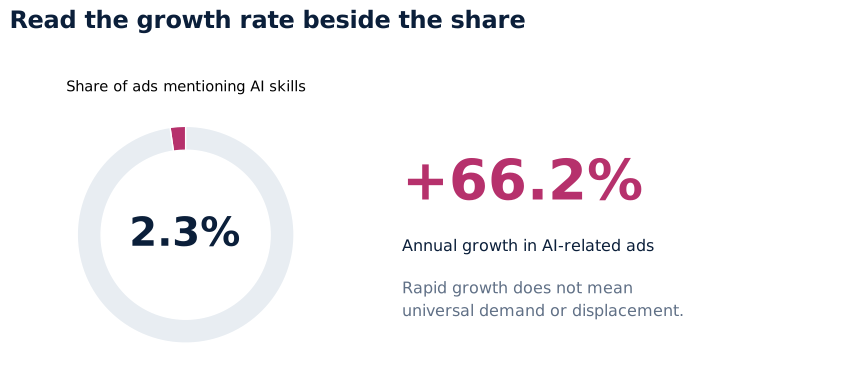
SEEK reported AI skills in 2.3% of advertisements in August, rising to 3.0% in NSW. AI-related ads grew 3.9% in the month and 66.2% over the year. Agentic AI references rose 185.3% annually and AI Ethics and Governance references 153.6%.
Large growth rates deserve attention, but they do not establish that most roles require these skills. The 2.3% share provides the scale that the annual growth headline alone cannot. These figures measure mentions in advertisements. They do not measure productivity, actual adoption, job displacement or an employer's willingness to hire an inexperienced AI practitioner.
The practical question is whether a target role asks for applied AI capability and what credible proof would demonstrate it. For a governance role, that may concern controls and accountability. For an operations role, it may concern a documented workflow improvement. Generic enthusiasm is a weaker signal than relevant evidence.
Our marketing implication is similarly bounded. AI can support a targeted learning conversation. This report cannot support a claim that everyone must retrain urgently or that a course will protect someone from displacement.
06 / The candidate decision
Start where the campaign is actually stopping.
A capable person with few interviews needs a different investigation from someone receiving interviews but no offers. The first case requires a close look at lane, role fit, evidence and application execution. The second moves attention toward interview translation, employer concerns, proof and final-stage competition. Neither diagnosis follows automatically from SEEK's national figure.
Begin with a bounded record: target role families, location and level; a representative set of live advertisements; the résumé and LinkedIn evidence; and applications, screens, interviews and offers by date. Record active applications separately from completed decisions so that slow employer processes do not masquerade as rejection.
Then state a primary hypothesis and a credible alternative. If the hypothesis is that experience is being misread, identify the exact requirement the evidence fails to make visible. If the alternative is poor underlying fit, specify what would distinguish it. A diagnosis becomes useful when it can be contradicted.
For the next five to ten suitable applications, keep the test narrow enough to interpret. Change the leading evidence or one target cluster, record the employer response, and preserve what you learn. A small campaign test cannot prove causation, but it can replace an unexamined story with better evidence.
The prize is a better next decision, followed by an application that can survive scrutiny.
07 / What we changed our mind about
The evidence should be allowed to push back.
August supports the proposition that the market is not one market. The state and industry differences are too material to hide inside a national mood. It also strengthens the case for interpreting demand and competition separately.
It weakens a blanket account of professional opportunity. Banking, HR and Marketing each improved in the month, even while several annual series remained negative. It rejects continuous deterioration as the only narrative and gives us no warrant for AI fear marketing.
The line 'More applications cannot fix the wrong market' remains a strategic hypothesis, not a diagnosis of every unsuccessful search. A well-targeted candidate may still need sufficient volume, time and channel coverage. The discipline is to distinguish productive repetition from repeated pursuit of an unsupported role.
That is the standard for this publication: report the movement, expose the limits, and change the interpretation when the evidence changes. Certainty should increase because the questions become more answerable, not because the language becomes louder.
08 / THE FIELD GUIDE
Five decisions to take back to your campaign.
Locate the bottleneck
Separate market pressure from lane, role, evidence, application and conversion hypotheses. Start with observed campaign progression.
Name the defensible lane
Match the real requirements of current roles to verified achievements, scope and constraints. Keep the gaps visible.
Allocate the pursuit
Pursue where fit, evidence and access justify the effort. Investigate uncertainty. Pass where essential requirements cannot be supported.
Lead with the proof
Make the most relevant evidence retrievable in the application and interview. A clear case must remain a truthful case.
Record what changed
Preserve the response, objection, decision and next test. Reassess the hypothesis when the market or the campaign contradicts it.
A practical starting point: choose one role cluster, inspect five current advertisements, identify the common employer problem and locate three verified examples that demonstrate relevant capability. If the fit remains uncertain, investigate before investing in the full application.
09 / THE EVIDENCE DESK
Sources, revisions and the limits of the view.
Primary source: SEEK Employment Report for August 2026. Historical national and state series: SEEK Employment and Salary data, workbook updated 15 October 2026. Charts and interpretations by FitGrid using SEEK data. National headline cards retain the release's rounded figures; workbook charts use the current revised estimates.
Read the methodology and revision notes
Applications per advertisement have a one-month reporting lag. August demand is paired at release with July applications. The independently rebased national chart aligns observations by their actual month and stops the applications series at its latest available observation.
SEEK moved headline reporting to trend estimates from August 2025. Trend smoothing reduces monthly noise but revises recent observations; it does not remove uncertainty. Seasonally adjusted and trend movements should not be spliced as one consistent headline series.
Company listings enter the reported series from November 2025, affecting composition and comparability. The January 2016 applications series break and COVID-period trend breaks constrain long-run comparisons. This issue's chart begins in January 2025; it does not infer a continuous growth rate across those older breaks.
In the October workbook August ads are +0.44% month on month, compared with +0.5% at release. July applications per ad are +1.73%, compared with +0.4% published in August. September ads are +0.62%; August applications per ad are +1.69%. Rounding and revision must be distinguished. Older issues preserve what the release reported; later estimates are identified here.
Industry categories, state series and AI mentions do not provide an occupation-by-seniority-by-location cross-tabulation. State indices do not establish comparable absolute applicant counts. SEEK platform data do not measure the entire labour market, unique jobseekers, vacancy quality or an individual's chance of an offer. No causal effect or employment guarantee is claimed.
August opens a possibility. It does not settle the outcome. The useful response is to look again, choose more precisely and make each pursuit leave evidence behind.
Connect the evidence to your campaign ↗