Employment Market Intelligence
Recovery Without Relief.
A second monthly rise. A broader set of industries improving. Another record for application pressure. The recovery is becoming more visible, but its benefits remain unevenly distributed.
Take the illustrated edition with you PDF ↓FROM THE EDITOR
September gives August's early turn a second observation. SEEK reported job advertisements up 0.6%, with 20 of 28 industries improving. Applications per advertisement also rose 1.7% to a record. The opportunity picture is improving. The competition for it is not easing in the same way.
This is the third issue in a continuing reading of Australia's employment market. Read it alongside July's Fewer Jobs. More Competition. Figures attributed to SEEK describe advertised demand and application activity. The candidate implications are FitGrid's interpretation.
01 / The developing turn
Two observations change the question.
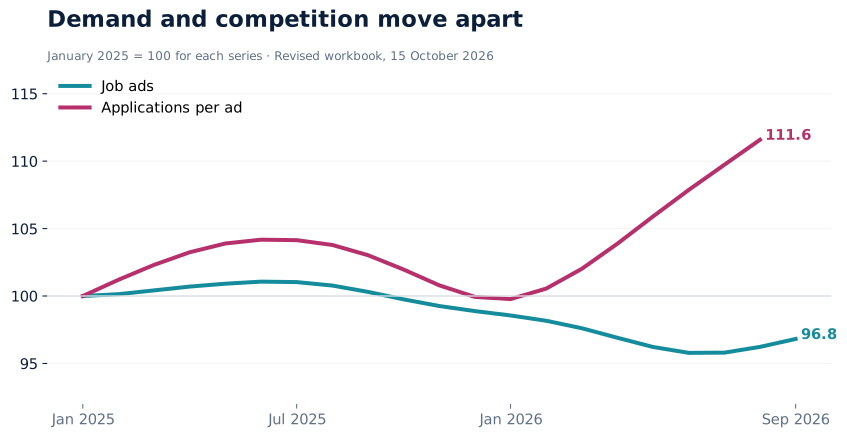
July's public edition examined a tightening market. August introduced the possibility of a turn. September broadens the evidence for improvement: advertisements increased 0.6% in the month, following the rise reported for August, while annual decline narrowed to 3.5%.
This is more encouraging than another fall. It is not a return to the previous year's level. A narrowing annual decline tells us that the distance is shrinking, while the negative sign tells us that the distance remains. Both belong in the same reading.
The breadth also matters. Twenty of SEEK's 28 industry categories improved monthly. That is a wider opportunity signal than a headline carried by one or two large classifications. It warrants a fresh look at target lists that may have become stale during the earlier contraction.
Our judgment is to call this an emerging recovery in advertised demand, with qualifications. Two positive headline months are not a forecast, and smoothed trend estimates can be revised. The campaign question shifts from whether anything is improving to whether the improvement reaches the candidate's defensible lane.
02 / The unresolved pressure
More openings can still mean a crowded contest.
Applications per advertisement rose 1.7% in the September release and reached a record high. This measure refers to August applications, not September. September demand and August competition are the latest observations published together, not two measurements of the same month.
Where the months do align, the October workbook places August ads up 0.44% and August applications per ad up 1.69%. Both can rise together. More advertisements do not mechanically produce a lower applications-per-ad ratio when application activity is also changing.
The ratio does not reveal a candidate's probability of success. It contains multiple applications by individuals and says nothing about the quality of each field. Nor can it establish that employers are screening faster, using particular software or rejecting qualified people for a specific reason.
What it does justify is discipline about interpretation. An unsuccessful search should not be explained solely by a recovering headline, and a crowded market should not become an excuse to stop inspecting the candidate's own evidence. External conditions and campaign execution need to be examined together.
The recovery is in the advertisements. Relief has to be tested in the candidate's actual market.
03 / The state of the states
The annual map still divides Australia.
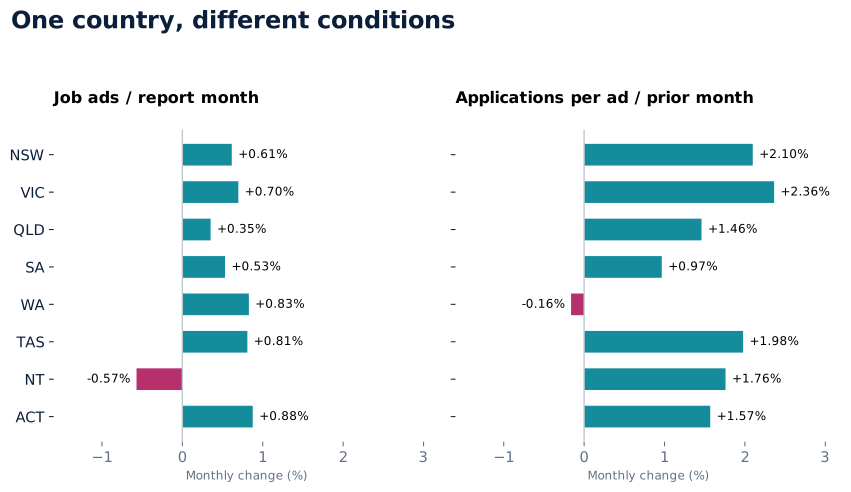
In the 15 October workbook, September's monthly advertisement growth ranges from +0.88% in the ACT and +0.83% in WA to −0.57% in the NT. Seven of the eight state and territory series are positive. The annual map is much less uniform.
WA stands at +4.43% year on year and SA at +1.21%. NSW remains −6.90%, the ACT −8.11% and the NT −13.47%. A monthly lift in the ACT therefore coexists with a substantial annual shortfall. That is improvement from a lower base, not proof that the earlier weakness has been erased.
Application pressure tells a different geographic story. August applications per ad increased 2.36% in Victoria, 2.10% in NSW and 1.98% in Tasmania. WA was slightly lower at −0.16%. These are within-state growth comparisons, not a comparison of absolute applicant numbers between states.
For an experienced professional, the decision is not simply to follow the strongest state. It is to ask whether suitable employers are accessible, whether the role matches the evidence, and whether relocation or remote work is realistic. Geographic demand is one input to that decision.
04 / The recovery broadens
Consumer activity joins the story.
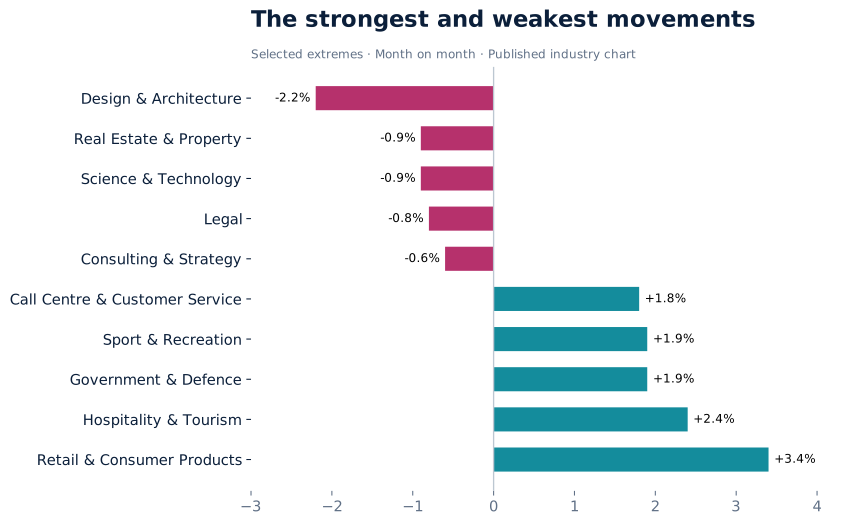
Retail and Consumer Products rose 3.4% in September. Hospitality and Tourism rose 2.4%, following August's 3.6% increase. Manufacturing, Transport and Logistics increased 1.5%, Mining 1.6% and Government and Defence 1.9%. The monthly improvement reaches beyond the industrial categories that featured prominently in July.
There are also limits. Design and Architecture fell 2.2%, Real Estate and Property 0.9%, Science and Technology 0.9%, and Legal 0.8%. HR declined 0.1%. A broadening recovery is not universal growth.
The difference between direction and level remains essential. A category can rise after a long decline and still provide fewer openings than a year earlier. The September monthly chart shows momentum; it should not be used to imply that each improving category has recovered its previous annual position.
The candidate implication is a refreshed opportunity inventory. Revisit suitable employers and role clusters rather than merely repeating the same keyword search. A broader market can create adjacent openings, but adjacency still needs proof: comparable problems, appropriate scope, credible achievements and a transition story an employer can evaluate.
05 / AI in proportion
The signal grows without becoming the whole market.
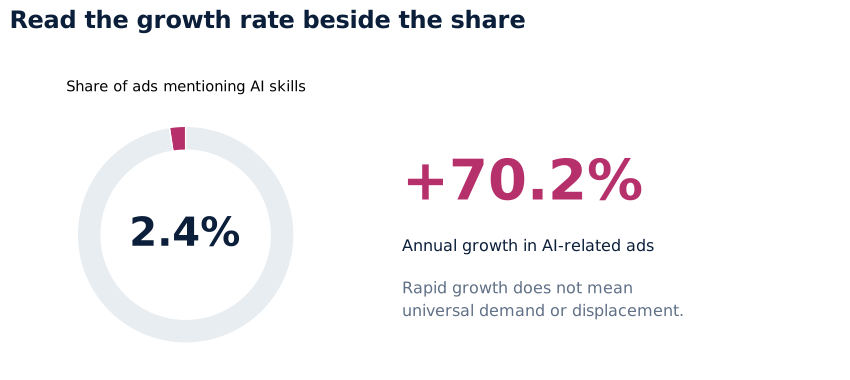
SEEK reported AI skills in 2.4% of September advertisements and annual growth of 70.2% in AI-related ads. August's corresponding figures were 2.3% and 66.2%. The share increased by 0.1 percentage points between the published releases.
A 70.2% annual growth rate is attention-worthy. A 2.4% share is equally important context. Neither figure establishes what proportion of all work is being automated or whether an individual role is safe. Advertisement language and the work actually performed are related but different observations.
For candidates, applied evidence matters more than a universal AI identity. Read the role: is the employer asking for technical development, responsible governance, workflow adoption, analysis or simply familiarity? The answer determines what needs to be demonstrated.
For FitGrid, this supports targeted interpretation and rejects a fear-based promise. A credible campaign can make relevant capability visible. It cannot promise immunity from technological change or manufacture competence through phrasing.
06 / What to do with a recovery
Refresh the strategy before increasing the effort.
A market turn creates a specific risk: old assumptions survive after conditions change. A role family dismissed during a contraction may deserve another look. A search allocation built around last quarter's openings may be lagging the current opportunity set. Updating the market view is therefore part of campaign maintenance.
Start with the actual bottleneck. If applications do not become screens, inspect eligibility, role fit and the visibility of relevant evidence. If screens do not become interviews, inspect the proposition and transition story. If interviews do not become offers, investigate the concerns raised, proof used and alternatives the employer considered. These are hypotheses to test, not universal rules.
Choose a small set of role clusters and review current advertisements for recurring problems. Record which requirements are essential, which are preferences and which are genuinely evidenced by the candidate. A rising industry does not rescue a weak case for an individual role.
Then run a bounded campaign test. Track applications, screens, interviews and offers with dates, channel and role cluster. Review completed decisions rather than treating every unanswered application as a final rejection. Retain contradictory evidence. A useful campaign becomes more intelligent even before it produces an offer.
Do not let a better headline become a substitute for a better decision.
07 / The argument after three issues
What survives, and what has to change.
July's warning about application pressure survives. September's record makes it harder to argue that a modest demand recovery automatically creates an easy search. The uneven-market thesis also survives the state and industry evidence.
The narrative of relentless contraction does not survive. August and September require a different account: advertised demand is improving, the improvement is broadening, and competition remains intense. An intelligence publication should be able to say all three without forcing them into a simple mood.
'More applications cannot fix the wrong market' still needs careful use. The claim addresses misallocation of effort. It does not establish that volume is irrelevant, that every unsuccessful candidate is targeting badly, or that a diagnosis guarantees success. An appropriate strategy can still encounter timing, competition and employer uncertainty.
The next evidence to watch is whether the demand improvement persists, whether annual weakness narrows across more categories, and whether applications per ad eventually stabilise. For the individual, the more immediate evidence is whether the refreshed strategy improves the quality and progression of real opportunities.
08 / THE FIELD GUIDE
Five decisions to take back to your campaign.
Locate the bottleneck
Separate market pressure from lane, role, evidence, application and conversion hypotheses. Start with observed campaign progression.
Name the defensible lane
Match the real requirements of current roles to verified achievements, scope and constraints. Keep the gaps visible.
Allocate the pursuit
Pursue where fit, evidence and access justify the effort. Investigate uncertainty. Pass where essential requirements cannot be supported.
Lead with the proof
Make the most relevant evidence retrievable in the application and interview. A clear case must remain a truthful case.
Record what changed
Preserve the response, objection, decision and next test. Reassess the hypothesis when the market or the campaign contradicts it.
A practical starting point: choose one role cluster, inspect five current advertisements, identify the common employer problem and locate three verified examples that demonstrate relevant capability. If the fit remains uncertain, investigate before investing in the full application.
09 / THE EVIDENCE DESK
Sources, revisions and the limits of the view.
Primary source: SEEK Employment Report for September 2026. Historical national and state series: SEEK Employment and Salary data, workbook updated 15 October 2026. Charts and interpretations by FitGrid using SEEK data. National headline cards retain the release's rounded figures; workbook charts use the current revised estimates.
Read the methodology and revision notes
Applications per advertisement have a one-month reporting lag. September demand is paired at release with August applications. The independently rebased national chart aligns observations by their actual month and stops the applications series at its latest available observation.
SEEK moved headline reporting to trend estimates from August 2025. Trend smoothing reduces monthly noise but revises recent observations; it does not remove uncertainty. Seasonally adjusted and trend movements should not be spliced as one consistent headline series.
Company listings enter the reported series from November 2025, affecting composition and comparability. The January 2016 applications series break and COVID-period trend breaks constrain long-run comparisons. This issue's chart begins in January 2025; it does not infer a continuous growth rate across those older breaks.
In the October workbook August ads are +0.44% month on month, compared with +0.5% at release. July applications per ad are +1.73%, compared with +0.4% published in August. September ads are +0.62%; August applications per ad are +1.69%. Rounding and revision must be distinguished. Older issues preserve what the release reported; later estimates are identified here.
Industry categories, state series and AI mentions do not provide an occupation-by-seniority-by-location cross-tabulation. State indices do not establish comparable absolute applicant counts. SEEK platform data do not measure the entire labour market, unique jobseekers, vacancy quality or an individual's chance of an offer. No causal effect or employment guarantee is claimed.
A recovery creates room to reconsider. The advantage comes from turning that room into a clearer choice, a stronger case and a campaign that learns.
Connect the evidence to your campaign ↗